Why SQLite Performance Tuning made Bencher 1200x Faster

Everett Pompeii
Last week, I got feedback from a user that their Bencher Perf Page was taking a while to load. So I decided to check it out, and oh, man were they being nice. It took sooo long to load! Embarrassingly long. Especially for the leading Continuous Benchmarking tool.
In the past, I’ve used the Rustls Perf Page as my litmus test. They have 112 benchmarks and one of the most impressive Continuous Benchmarking setups out there. It used to take about 5 seconds load. This time around it took… ⏳👀 … 38.8 seconds! With that sort of latency, I had to dig in. Performance bugs are bugs, after all!
Background
From the very start, I knew that the Bencher Perf API was going to be one of the most demanding endpoints performance wise. I believe the main reason that so many folks have had to reinvent the benchmark tracking wheel is that the existing off-the-shelf tools don’t handle the high dimensionality required. By “high dimensionality”, I mean being able to track performance over time and across multiple dimensions: Branches, Testbeds, Benchmarks, and Measures. This ability to slice and dice across five different dimensions leads to a very complex model.
Because of this inherent complexity and the nature of the data, I considered using a time series database for Bencher. In the end though, I settled on using SQLite instead. I figured it was better to do things that don’t scale than to spend the extra time learning an entirely new database architecture that may or may not actually help.
Over time, the demands on the Bencher Perf API have also increased. Originally, you had to select all of the dimensions that you wanted to plot manually. This created a lot of friction for users to get to a useful plot. To solve this, I added a list of the most recent Reports to the Perf Pages, and by default, the most recent Report was selected and plotted. This means that if there were 112 benchmarks in the most recent Report, then all 112 would be plotted. The model also got even more complicated with the ability to track and visualize Threshold Boundaries.
With this in mind, I made a few performance related improvements. Since the Perf Plot needs the most recent Report to start plotting, I refactored the Reports API to get a Report’s result data in a single call to the database instead of iterating. The time window for the default Report query was set to four weeks, instead of being unbounded. I also drastically limited the scope of all database handles, reducing lock contention. To help communicate to users, I added a status bar spinner for both the Perf Plot and the dimension tabs.
I also had a failed attempt last fall at using a composite query to get all Perf results into a single query, instead of using a quadruple nested for loop. This lead to me hitting the Rust type system recursion limit, repeatedly overflowing the stack, suffering through insane (much longer than 38 seconds) compile times, and finally dead ending at SQLite’s max number of terms in a compound select statement.
With all of that under my belt, I knew that I really needed to dig in here and put my performance engineer pants on. I had never profiled a SQLite database before, and honestly, I had never really profiled any database before. Now wait a minute you might might be thinking. My LinkedIn profile says I was a “Database Administrator” for almost two years. And I never profiled a database‽ Yep. That’s a story for another time I suppose.
From ORM to SQL Query
The first hurdle I ran into was getting the SQL query out of my Rust code. I use Diesel as the object–relational mapper (ORM) for Bencher.
🐰 Fun Fact: Diesel uses Bencher for their Relative Continuous Benchmarking. Check out the Diesel Perf Page!
Diesel creates parameterized queries.
It sends the SQL query and its bind parameters separately to the database.
That is, the substitution is done by the database.
Therefore, Diesel cannot provide a complete query to the user.
The best method that I found was using the diesel::debug_query function to output the parameterized query:
Query { sql: "SELECT `branch`.`id`, `branch`.`uuid`, `branch`.`project_id`, `branch`.`name`, `branch`.`slug`, `branch`.`start_point_id`, `branch`.`created`, `branch`.`modified`, `testbed`.`id`, `testbed`.`uuid`, `testbed`.`project_id`, `testbed`.`name`, `testbed`.`slug`, `testbed`.`created`, `testbed`.`modified`, `benchmark`.`id`, `benchmark`.`uuid`, `benchmark`.`project_id`, `benchmark`.`name`, `benchmark`.`slug`, `benchmark`.`created`, `benchmark`.`modified`, `measure`.`id`, `measure`.`uuid`, `measure`.`project_id`, `measure`.`name`, `measure`.`slug`, `measure`.`units`, `measure`.`created`, `measure`.`modified`, `report`.`uuid`, `report_benchmark`.`iteration`, `report`.`start_time`, `report`.`end_time`, `version`.`number`, `version`.`hash`, `threshold`.`id`, `threshold`.`uuid`, `threshold`.`project_id`, `threshold`.`measure_id`, `threshold`.`branch_id`, `threshold`.`testbed_id`, `threshold`.`model_id`, `threshold`.`created`, `threshold`.`modified`, `model`.`id`, `model`.`uuid`, `model`.`threshold_id`, `model`.`test`, `model`.`min_sample_size`, `model`.`max_sample_size`, `model`.`window`, `model`.`lower_boundary`, `model`.`upper_boundary`, `model`.`created`, `model`.`replaced`, `boundary`.`id`, `boundary`.`uuid`, `boundary`.`threshold_id`, `boundary`.`model_id`, `boundary`.`metric_id`, `boundary`.`baseline`, `boundary`.`lower_limit`, `boundary`.`upper_limit`, `alert`.`id`, `alert`.`uuid`, `alert`.`boundary_id`, `alert`.`boundary_limit`, `alert`.`status`, `alert`.`modified`, `metric`.`id`, `metric`.`uuid`, `metric`.`report_benchmark_id`, `metric`.`measure_id`, `metric`.`value`, `metric`.`lower_value`, `metric`.`upper_value` FROM (((`metric` INNER JOIN ((`report_benchmark` INNER JOIN ((`report` INNER JOIN (`version` INNER JOIN (`branch_version` INNER JOIN `branch` ON (`branch_version`.`branch_id` = `branch`.`id`)) ON (`branch_version`.`version_id` = `version`.`id`)) ON (`report`.`version_id` = `version`.`id`)) INNER JOIN `testbed` ON (`report`.`testbed_id` = `testbed`.`id`)) ON (`report_benchmark`.`report_id` = `report`.`id`)) INNER JOIN `benchmark` ON (`report_benchmark`.`benchmark_id` = `benchmark`.`id`)) ON (`metric`.`report_benchmark_id` = `report_benchmark`.`id`)) INNER JOIN `measure` ON (`metric`.`measure_id` = `measure`.`id`)) LEFT OUTER JOIN (((`boundary` INNER JOIN `threshold` ON (`boundary`.`threshold_id` = `threshold`.`id`)) INNER JOIN `model` ON (`boundary`.`model_id` = `model`.`id`)) LEFT OUTER JOIN `alert` ON (`alert`.`boundary_id` = `boundary`.`id`)) ON (`boundary`.`metric_id` = `metric`.`id`)) WHERE ((((((`branch`.`uuid` = ?) AND (`testbed`.`uuid` = ?)) AND (`benchmark`.`uuid` = ?)) AND (`measure`.`uuid` = ?)) AND (`report`.`start_time` >= ?)) AND (`report`.`end_time` <= ?)) ORDER BY `version`.`number`, `report`.`start_time`, `report_benchmark`.`iteration`", binds: [BranchUuid(a7d8366a-4f9b-452e-987e-2ae56e4bf4a3), TestbedUuid(5b4a6f3e-a27d-4cc3-a2ce-851dc6421e6e), BenchmarkUuid(88375e7c-f1e0-4cbb-bde1-bdb7773022ae), MeasureUuid(b2275bbc-2044-4f8e-aecd-3c739bd861b9), DateTime(2024-03-12T12:23:38Z), DateTime(2024-04-11T12:23:38Z)] }And then hand cleaning and parameterizing the query into valid SQL:
SELECT branch.id, branch.uuid, branch.project_id, branch.name, branch.slug, branch.start_point_id, branch.created, branch.modified, testbed.id, testbed.uuid, testbed.project_id, testbed.name, testbed.slug, testbed.created, testbed.modified, benchmark.id, benchmark.uuid, benchmark.project_id, benchmark.name, benchmark.slug, benchmark.created, benchmark.modified, measure.id, measure.uuid, measure.project_id, measure.name, measure.slug, measure.units, measure.created, measure.modified, report.uuid, report_benchmark.iteration, report.start_time, report.end_time, version.number, version.hash, threshold.id, threshold.uuid, threshold.project_id, threshold.measure_id, threshold.branch_id, threshold.testbed_id, threshold.model_id, threshold.created, threshold.modified, model.id, model.uuid, model.threshold_id, model.test, model.min_sample_size, model.max_sample_size, model.window, model.lower_boundary, model.upper_boundary, model.created, model.replaced, boundary.id, boundary.uuid, boundary.threshold_id, boundary.model_id, boundary.metric_id, boundary.baseline, boundary.lower_limit, boundary.upper_limit, alert.id, alert.uuid, alert.boundary_id, alert.boundary_limit, alert.status, alert.modified, metric.id, metric.uuid, metric.report_benchmark_id, metric.measure_id, metric.value, metric.lower_value, metric.upper_value FROM (((metric INNER JOIN ((report_benchmark INNER JOIN ((report INNER JOIN (version INNER JOIN (branch_version INNER JOIN branch ON (branch_version.branch_id = branch.id)) ON (branch_version.version_id = version.id)) ON (report.version_id = version.id)) INNER JOIN testbed ON (report.testbed_id = testbed.id)) ON (report_benchmark.report_id = report.id)) INNER JOIN benchmark ON (report_benchmark.benchmark_id = benchmark.id)) ON (metric.report_benchmark_id = report_benchmark.id)) INNER JOIN measure ON (metric.measure_id = measure.id)) LEFT OUTER JOIN (((boundary INNER JOIN threshold ON (boundary.threshold_id = threshold.id)) INNER JOIN model ON (boundary.model_id = model.id)) LEFT OUTER JOIN alert ON (alert.boundary_id = boundary.id)) ON (boundary.metric_id = metric.id)) WHERE ((((((branch.uuid = 'a7d8366a-4f9b-452e-987e-2ae56e4bf4a3') AND (testbed.uuid = '5b4a6f3e-a27d-4cc3-a2ce-851dc6421e6e')) AND (benchmark.uuid = '88375e7c-f1e0-4cbb-bde1-bdb7773022ae')) AND (measure.uuid = 'b2275bbc-2044-4f8e-aecd-3c739bd861b9')) AND (report.start_time >= 0)) AND (report.end_time <= 1712838648197)) ORDER BY version.number, report.start_time, report_benchmark.iteration;If you know of a better way, please let me know! This is the way that the maintainer of the project suggested though, so I just went with it. Now that I had a SQL query, I was finally ready to… read a whole lot of documentation.
SQLite Query Planner
The SQLite website has great documentation for its Query Planner. It explains exactly how SQLite goes about executing your SQL query, and it teaches you which indexes are useful and what operations to look out for, like full table scans.
In order to see how the Query Planner would execute my Perf query,
I needed to add a new tool to my tool belt: EXPLAIN QUERY PLAN
You can either prefix your SQL query with EXPLAIN QUERY PLAN
or run the .eqp on dot command before your query.
Either way, I got a result that looks like this:
QUERY PLAN|--MATERIALIZE (join-5)| |--SCAN boundary| |--SEARCH threshold USING INTEGER PRIMARY KEY (rowid=?)| |--SEARCH model USING INTEGER PRIMARY KEY (rowid=?)| |--BLOOM FILTER ON alert (boundary_id=?)| `--SEARCH alert USING AUTOMATIC COVERING INDEX (boundary_id=?) LEFT-JOIN|--SEARCH branch USING INDEX sqlite_autoindex_branch_1 (uuid=?)|--SEARCH measure USING INDEX sqlite_autoindex_measure_1 (uuid=?)|--SEARCH benchmark USING INDEX sqlite_autoindex_benchmark_1 (uuid=?)|--SEARCH testbed USING INDEX sqlite_autoindex_testbed_1 (uuid=?)|--SCAN metric|--SEARCH report_benchmark USING INTEGER PRIMARY KEY (rowid=?)|--SEARCH report USING INTEGER PRIMARY KEY (rowid=?)|--SEARCH version USING INTEGER PRIMARY KEY (rowid=?)|--SEARCH branch_version USING COVERING INDEX sqlite_autoindex_branch_version_1 (branch_id=? AND version_id=?)|--BLOOM FILTER ON (join-5) (metric_id=?)|--SEARCH (join-5) USING AUTOMATIC COVERING INDEX (metric_id=?) LEFT-JOIN`--USE TEMP B-TREE FOR ORDER BYOh, boy! There is a lot here. But the three big things that jumped out to me where:
- SQLite is creating an on-the-fly view that scans the entire
boundarytable - SQLite is then scanning the entire
metrictable - SQLite is creating two on the fly indexes
And just how big are the metric and boundary tables?
Well they just so happen to be the two largest tables,
as they are where all the Metrics and Boundaries are stored.
Since this was my first SQLite performance tuning rodeo, I wanted to consult an expert before making any changes.
SQLite Expert
SQLite has an experimental “expert” mode that can be enabled with the .expert command.
It suggests indexes for queries, so I decided to give it a try.
This is what it suggested:
CREATE INDEX report_benchmark_idx_fc6f3e5b ON report_benchmark(report_id, benchmark_id);CREATE INDEX report_idx_55aae6d8 ON report(testbed_id, end_time);CREATE INDEX alert_idx_e1882f70 ON alert(boundary_id);
MATERIALIZE (join-5)SCAN boundarySEARCH threshold USING INTEGER PRIMARY KEY (rowid=?)SEARCH model USING INTEGER PRIMARY KEY (rowid=?)SEARCH alert USING INDEX alert_idx_e1882f70 (boundary_id=?) LEFT-JOINSEARCH branch USING INDEX sqlite_autoindex_branch_1 (uuid=?)SEARCH benchmark USING INDEX sqlite_autoindex_benchmark_1 (uuid=?)SEARCH testbed USING INDEX sqlite_autoindex_testbed_1 (uuid=?)SEARCH measure USING INDEX sqlite_autoindex_measure_1 (uuid=?)SEARCH report USING INDEX report_idx_55aae6d8 (testbed_id=? AND end_time<?)SEARCH version USING INTEGER PRIMARY KEY (rowid=?)SEARCH branch_version USING COVERING INDEX sqlite_autoindex_branch_version_1 (branch_id=? AND version_id=?)SEARCH report_benchmark USING INDEX report_benchmark_idx_fc6f3e5b (report_id=? AND benchmark_id=?)SEARCH metric USING INDEX sqlite_autoindex_metric_2 (report_benchmark_id=? AND measure_id=?)BLOOM FILTER ON (join-5) (metric_id=?)SEARCH (join-5) USING AUTOMATIC COVERING INDEX (metric_id=?) LEFT-JOINUSE TEMP B-TREE FOR ORDER BY
This is definitely an improvement!
It got rid of the scan on the metric table and both of the on-the-fly indexes.
Honestly, I wouldn’t have gotten the first two indexes on my own.
Thank you, SQLite Expert!
CREATE INDEX index_report_testbed_end_time ON report(testbed_id, end_time);CREATE INDEX index_report_benchmark ON report_benchmark(report_id, benchmark_id);CREATE INDEX index_alert_boundary ON alert(boundary_id);Now the only thing left to get rid of was that darn SCAN boundary.
SQLite View
When I added the ability to track and visualize Threshold Boundaries last year,
I had a decision to make in the database model.
There is a 1-to-0/1 relationship between a Metric and its corresponding Boundary.
That is a Metric can relate to zero or one Boundary, and a Boundary can only ever relate to one Metric.
So I could have just expanded the metric table to include all of the boundary data with every boundary related field being nullable.
Or I could create a separate boundary table with a UNIQUE foreign key to metric table.
To me the latter option felt a lot cleaner, and I figured I could always deal with any performance implications later.
These were the effective queries used to create the metric and boundary tables:
CREATE TABLE metric ( id INTEGER PRIMARY KEY NOT NULL, uuid TEXT NOT NULL UNIQUE, report_benchmark_id INTEGER NOT NULL, measure_id INTEGER NOT NULL, value DOUBLE NOT NULL, lower_value DOUBLE, upper_value DOUBLE, FOREIGN KEY (report_benchmark_id) REFERENCES report_benchmark (id) ON DELETE CASCADE, FOREIGN KEY (measure_id) REFERENCES measure (id), UNIQUE(report_benchmark_id, measure_id));CREATE TABLE boundary ( id INTEGER PRIMARY KEY NOT NULL, uuid TEXT NOT NULL UNIQUE, threshold_id INTEGER NOT NULL, statistic_id INTEGER NOT NULL, metric_id INTEGER NOT NULL UNIQUE, baseline DOUBLE NOT NULL, lower_limit DOUBLE, upper_limit DOUBLE, FOREIGN KEY (threshold_id) REFERENCES threshold (id), FOREIGN KEY (statistic_id) REFERENCES statistic (id), FOREIGN KEY (metric_id) REFERENCES metric (id) ON DELETE CASCADE);And it turns out “later” had arrived.
I tried to simply add an index for boundary(metric_id), but that did not help.
I believe the reason has to do with the fact that the Perf query is originating from the metric table
and because that relationship is 0/1 or put another way, nullable it has to be scanned (O(n))
and cannot be searched (O(log(n))).
This left me with one clear option.
I needed to create a view that flattened the metric and boundary relationship
to keep SQLite from having to do a full of the boundary table.
This is the query I used to create the new metric_boundary view:
CREATE VIEW metric_boundary ASSELECT metric.id AS metric_id, metric.uuid AS metric_uuid, metric.report_benchmark_id, metric.measure_id, metric.value, metric.lower_value, metric.upper_value, boundary.id, boundary.uuid AS boundary_uuid, boundary.threshold_id AS threshold_id, boundary.model_id, boundary.baseline, boundary.lower_limit, boundary.upper_limitFROM metric LEFT OUTER JOIN boundary ON (boundary.metric_id = metric.id);With this solution, I created a pre-packaged SELECT statement.
This view only caused about a 4% increase in the size of the database,
even though it is for the two largest tables.
Best of all, it lets me have my cake and eat it too in my source code.
Creating a view with Diesel was surprisingly easy. I just had to use the exact same macros that Diesel uses when generating my normal schema. With that said, I learned to appreciate Diesel a lot more throughout this experience. See Bonus Bug for all the juicy details.
Wrap Up
With the three new indexes and a view added, this is what the Query Planner now shows:
QUERY PLAN|--SEARCH branch USING INDEX sqlite_autoindex_branch_1 (uuid=?)|--SEARCH testbed USING INDEX sqlite_autoindex_testbed_1 (uuid=?)|--SEARCH benchmark USING INDEX sqlite_autoindex_benchmark_1 (uuid=?)|--SEARCH measure USING INDEX sqlite_autoindex_measure_1 (uuid=?)|--SEARCH report USING INDEX index_report_testbed_end_time (testbed_id=? AND end_time<?)|--SEARCH version USING INTEGER PRIMARY KEY (rowid=?)|--SEARCH branch_version USING COVERING INDEX sqlite_autoindex_branch_version_1 (branch_id=? AND version_id=?)|--SEARCH report_benchmark USING INDEX index_report_benchmark (report_id=? AND benchmark_id=?)|--SEARCH metric USING INDEX sqlite_autoindex_metric_2 (report_benchmark_id=? AND measure_id=?)|--SEARCH boundary USING INDEX sqlite_autoindex_boundary_2 (metric_id=?) LEFT-JOIN|--SEARCH threshold USING INTEGER PRIMARY KEY (rowid=?) LEFT-JOIN|--SEARCH model USING INTEGER PRIMARY KEY (rowid=?) LEFT-JOIN|--SEARCH alert USING INDEX index_alert_boundary (boundary_id=?) LEFT-JOIN`--USE TEMP B-TREE FOR ORDER BYLook at all of those beautify SEARCHes all with existing indexes! 🥲
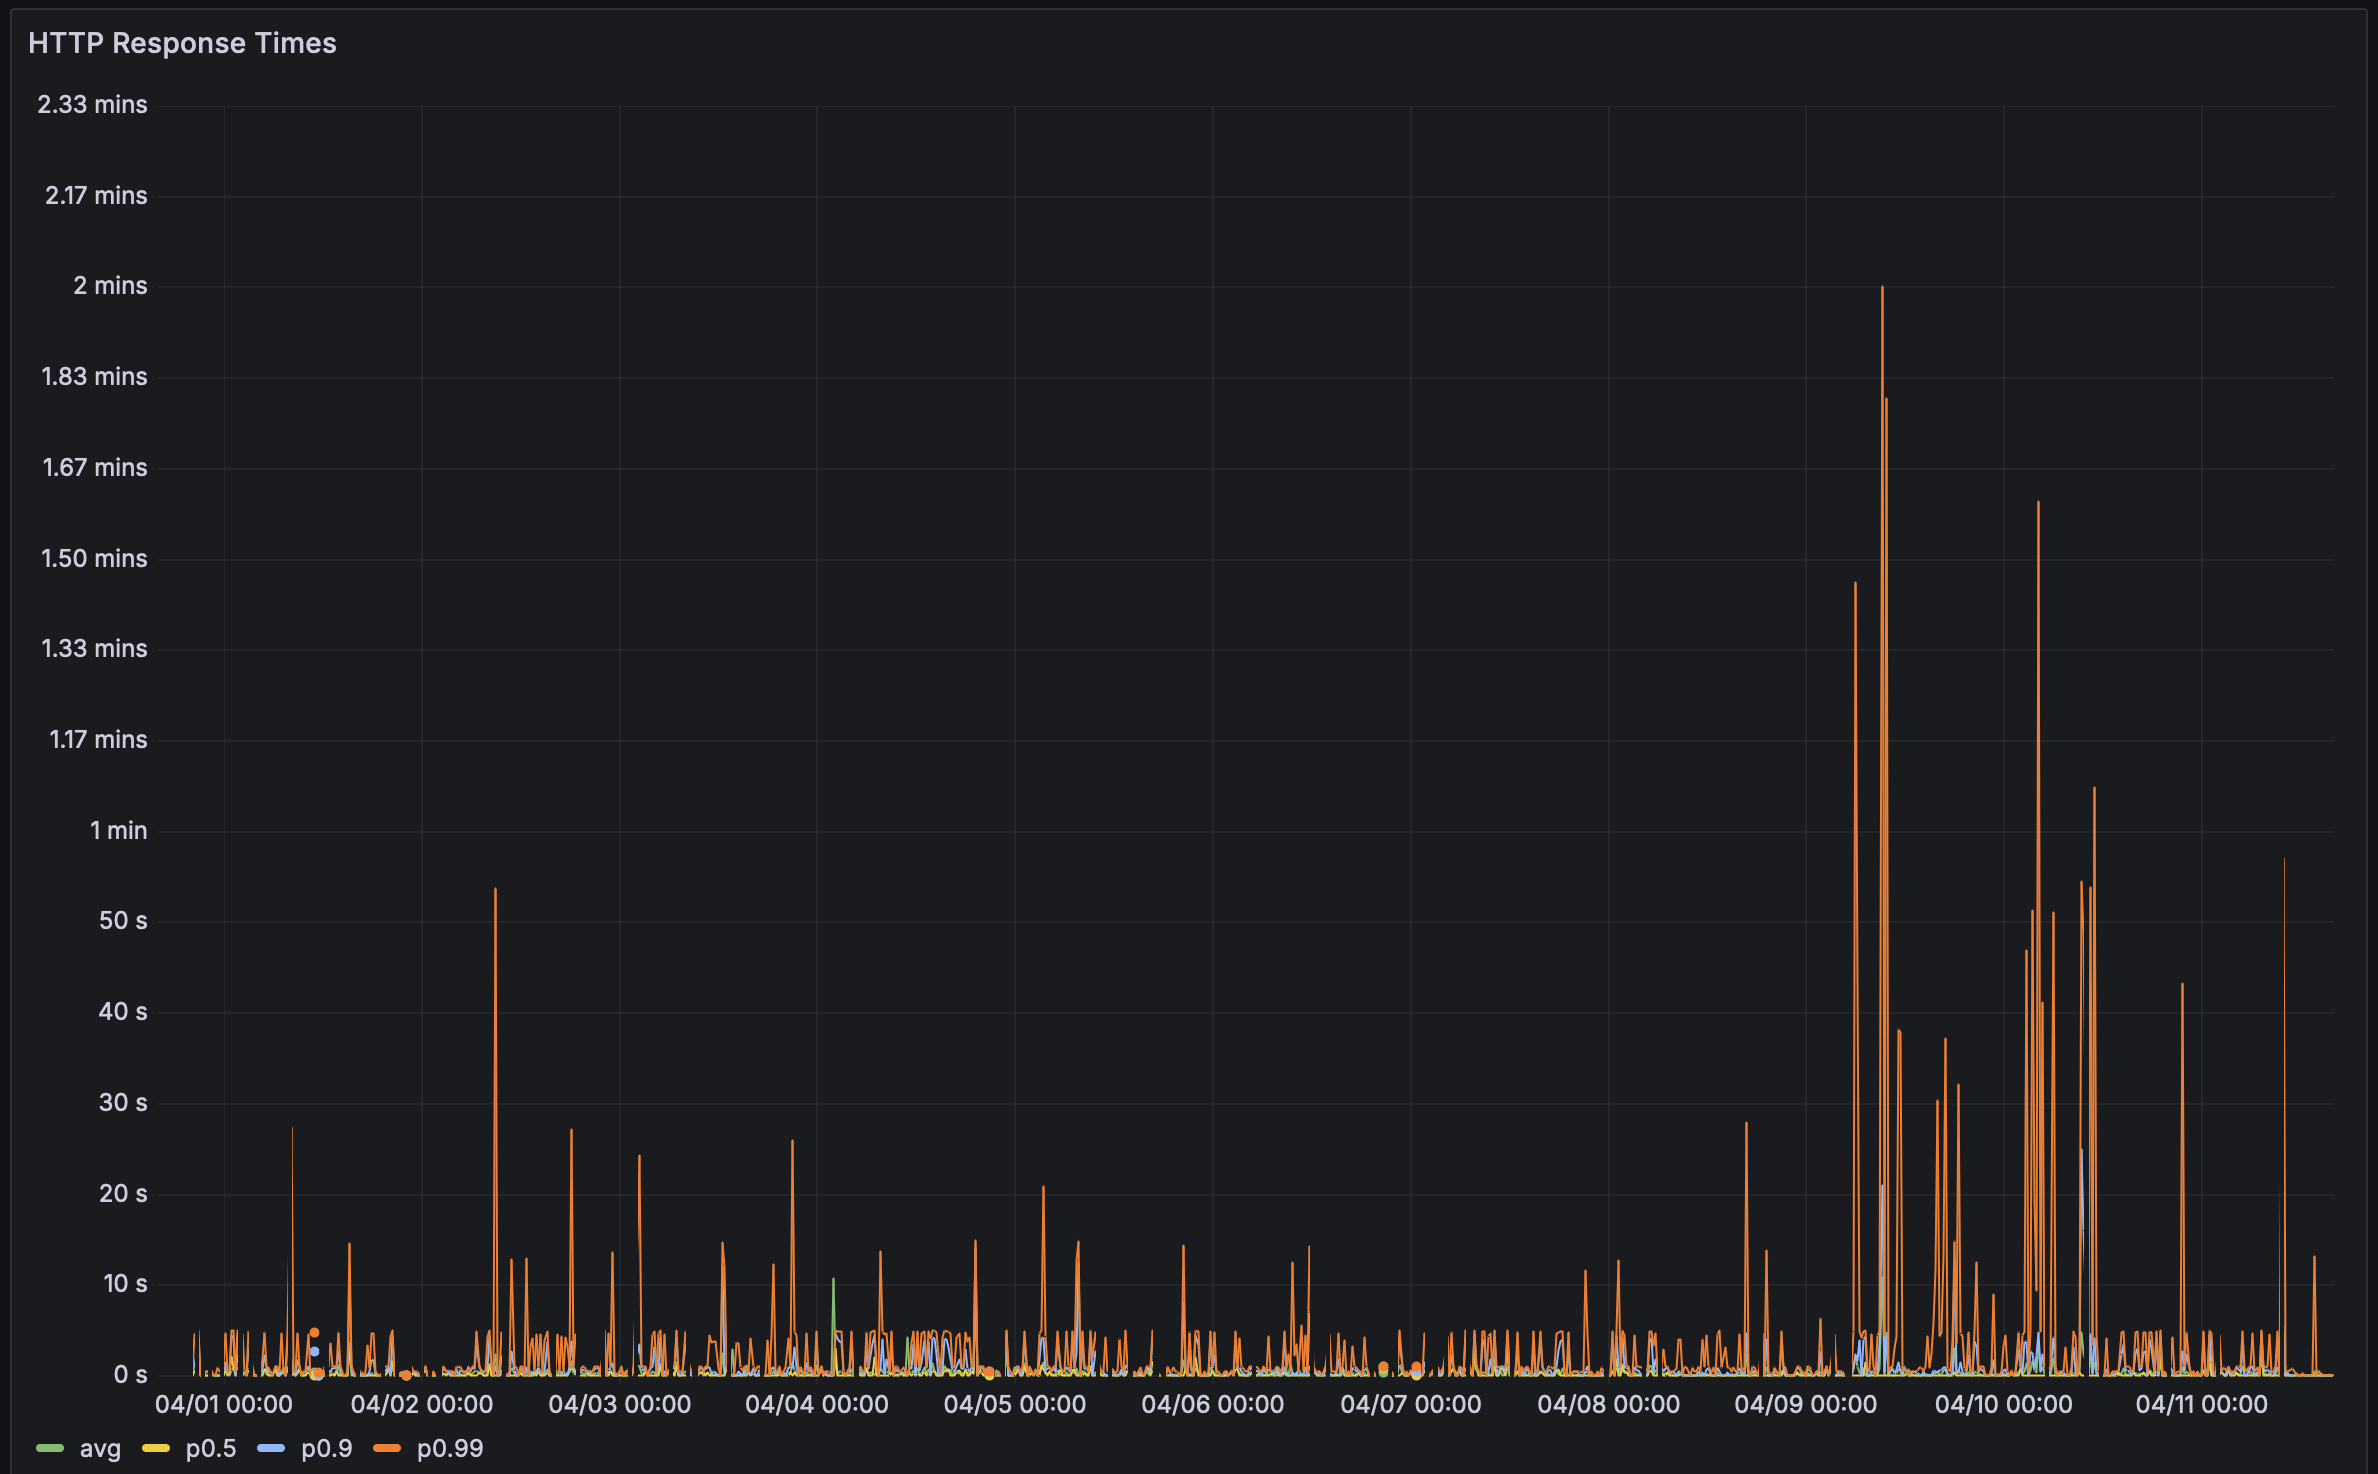
And after deploying my changes to production:
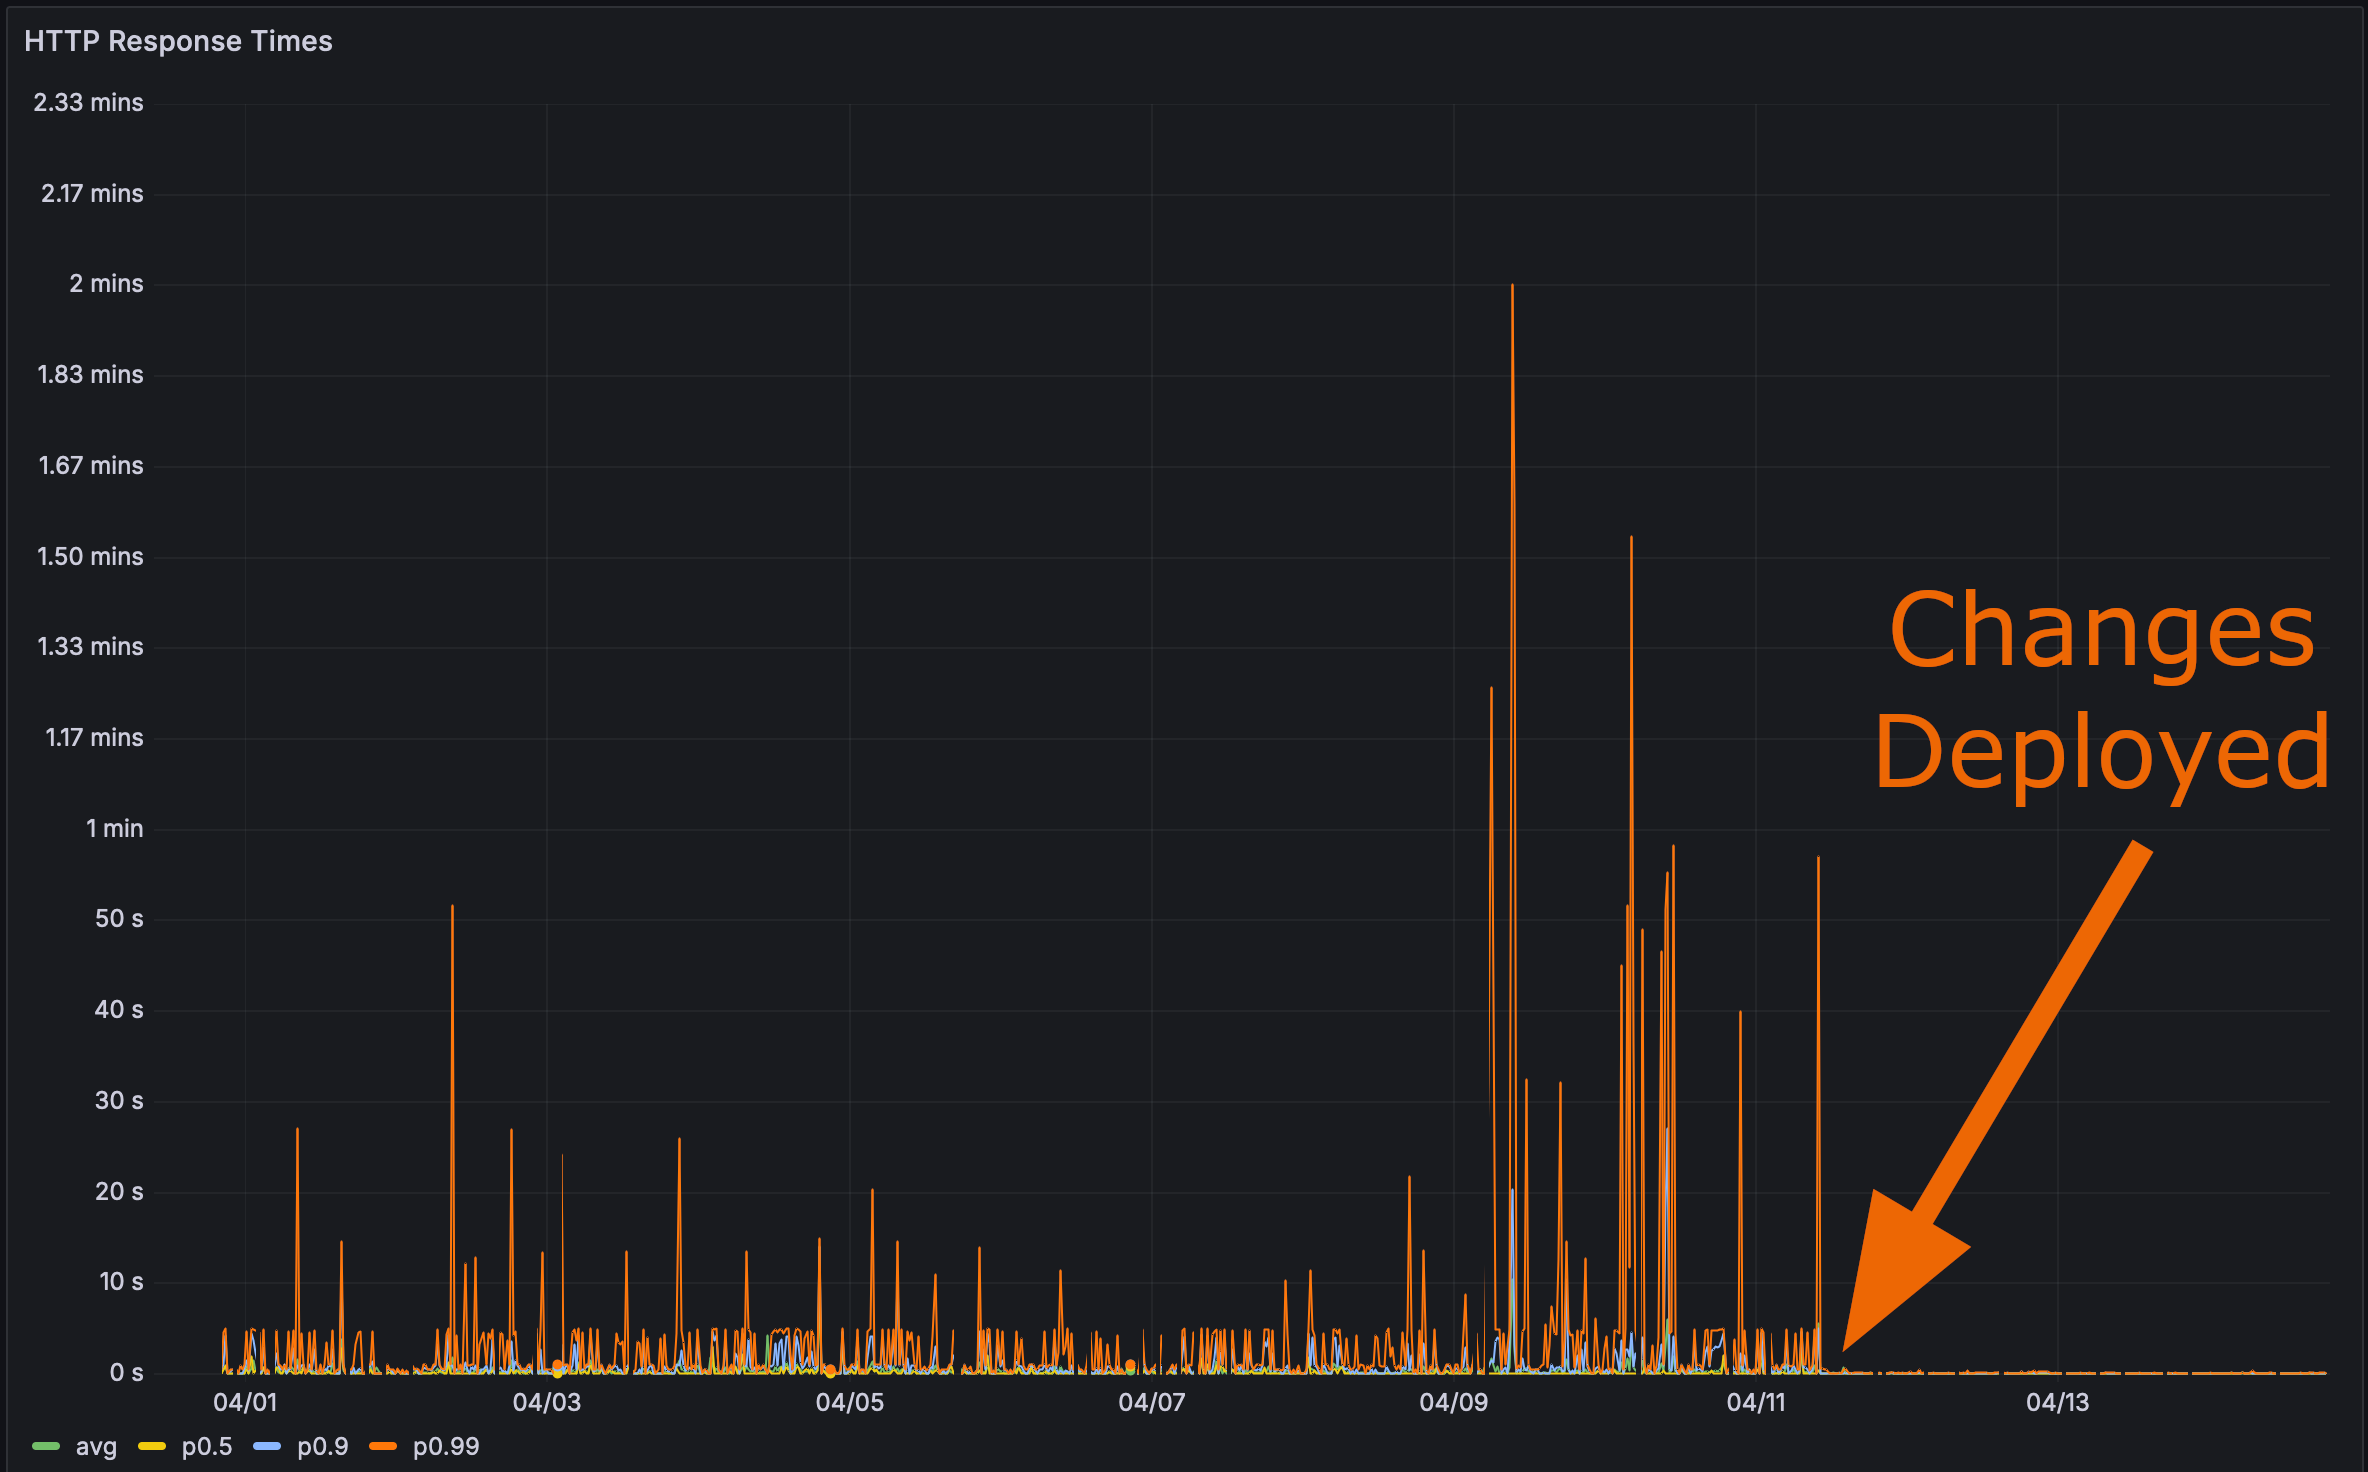
Now it was time for the final test. How fast does that Rustls Perf page load?
Here I’ll even give you anchor tag. Click it and then refresh the page.
Performance Matters
Bencher: Continuous Benchmarking

Bencher is a suite of continuous benchmarking tools. Have you ever had a performance regression impact your users? Bencher could have prevented that from happening. Bencher allows you to detect and prevent performance regressions before they merge.
- Run: Run your benchmarks locally or in CI using the exact same bare metal runners and your favorite benchmarking tools. The
bencherCLI orchestrates running your benchmarks on bare metal and stores the results. - Track: Track the results of your benchmarks over time. Monitor, query, and graph the results using the Bencher web console based on the source branch, testbed, benchmark, and measure.
- Catch: Catch performance regressions locally or in CI using the exact same bare metal hardware. Bencher uses state of the art, customizable analytics to detect performance regressions before they merge.
For the same reasons that unit tests are run to prevent feature regressions, benchmarks should be run with Bencher to prevent performance regressions. Performance bugs are bugs!
Start catching performance regressions before they merge — try Bencher Cloud for free.
Addendum on Dogfooding
I’m already dogfooding Bencher with Bencher, but all of the existing benchmark harness adapters are for micro-benchmarking harnesses. Most HTTP harnesses are really load testing harnesses, and load testing is different than benchmarking. Further, I’m not looking to expand Bencher into load testing anytime soon. That is a very different use case that would require very different design considerations, like that time series database for instance. Even if I did have load testing in place, I would really need to be running against a fresh pull of production data for this to have been caught. The performance differences for these changes were negligible with my test database.
Click to view test database benchmark results
Before:
Run Time: real 0.081 user 0.019532 sys 0.005618Run Time: real 0.193 user 0.022192 sys 0.003368Run Time: real 0.070 user 0.021390 sys 0.003369Run Time: real 0.062 user 0.022676 sys 0.002290Run Time: real 0.057 user 0.012053 sys 0.006638Run Time: real 0.052 user 0.018797 sys 0.002016Run Time: real 0.059 user 0.022806 sys 0.002437Run Time: real 0.066 user 0.021869 sys 0.004525Run Time: real 0.060 user 0.021037 sys 0.002864Run Time: real 0.059 user 0.018397 sys 0.003668After indexes and materialized view:
Run Time: real 0.063 user 0.008671 sys 0.004898Run Time: real 0.053 user 0.010671 sys 0.003334Run Time: real 0.053 user 0.010337 sys 0.002884Run Time: real 0.052 user 0.008087 sys 0.002165Run Time: real 0.045 user 0.007265 sys 0.002123Run Time: real 0.038 user 0.008793 sys 0.002240Run Time: real 0.040 user 0.011022 sys 0.002420Run Time: real 0.049 user 0.010004 sys 0.002831Run Time: real 0.059 user 0.010472 sys 0.003661Run Time: real 0.046 user 0.009968 sys 0.002628All of this leads me to believe that I should create a micro-benchmark that runs against the Perf API endpoint and dogfood the results with Bencher. This will require a sizable test database to make sure that these sort of performance regressions get caught in CI. I have created a tracking issue for this work, if you would like to follow along.
This has all got me thinking though: What if you could do snapshot testing of your SQL database query plan? That is, you could compare your current vs candidate SQL database query plans. SQL query plan testing would sort of be like instruction count based benchmarking for databases. The query plan helps to indicate that there may be an issue with the runtime performance, without having to actually benchmark the database query. I have created a tracking issue for this as well. Please, feel free to add a comment with thoughts or any prior art that you are aware of!
Bonus Bug
I originally had a bug in my code to create a view. This is what the SQL query looked like:
SELECT branch.id, branch.uuid, branch.project_id, branch.name, branch.slug, branch.start_point_id, branch.created, branch.modified, testbed.id, testbed.uuid, testbed.project_id, testbed.name, testbed.slug, testbed.created, testbed.modified, benchmark.id, benchmark.uuid, benchmark.project_id, benchmark.name, benchmark.slug, benchmark.created, benchmark.modified, measure.id, measure.uuid, measure.project_id, measure.name, measure.slug, measure.units, measure.created, measure.modified, report.uuid, report_benchmark.iteration, report.start_time, report.end_time, version.number, version.hash, threshold.id, threshold.uuid, threshold.project_id, threshold.measure_id, threshold.branch_id, threshold.testbed_id, threshold.model_id, threshold.created, threshold.modified, model.id, model.uuid, model.threshold_id, model.test, model.min_sample_size, model.max_sample_size, model.window, model.lower_boundary, model.upper_boundary, model.created, model.replaced, alert.id, alert.uuid, alert.boundary_id, alert.boundary_limit, alert.status, alert.modified, metric_boundary.metric_id, metric_boundary.metric_uuid, metric_boundary.report_benchmark_id, metric_boundary.measure_id, metric_boundary.value, metric_boundary.lower_value, metric_boundary.upper_value, metric_boundary.boundary_id, metric_boundary.boundary_uuid, metric_boundary.threshold_id, metric_boundary.model_id, metric_boundary.baseline, metric_boundary.lower_limit, metric_boundary.upper_limit FROM (((((metric_boundary INNER JOIN ((report_benchmark INNER JOIN ((report INNER JOIN (version INNER JOIN (branch_version INNER JOIN branch ON (branch_version.branch_id = branch.id)) ON (branch_version.version_id = version.id)) ON (report.version_id = version.id)) INNER JOIN testbed ON (report.testbed_id = testbed.id)) ON (report_benchmark.report_id = report.id)) INNER JOIN benchmark ON (report_benchmark.benchmark_id = benchmark.id)) ON (metric_boundary.report_benchmark_id = report_benchmark.id)) INNER JOIN measure ON (metric_boundary.measure_id = measure.id)) LEFT OUTER JOIN threshold ON (metric_boundary.threshold_id = threshold.id)) LEFT OUTER JOIN model ON (metric_boundary.model_id = model.id)) LEFT OUTER JOIN alert ON (alert.boundary_id = metric_boundary.metric_id)) WHERE ((((((branch.uuid = 'a7d8366a-4f9b-452e-987e-2ae56e4bf4a3') AND (testbed.uuid = '5b4a6f3e-a27d-4cc3-a2ce-851dc6421e6e')) AND (benchmark.uuid = '88375e7c-f1e0-4cbb-bde1-bdb7773022ae')) AND (measure.uuid = 'b2275bbc-2044-4f8e-aecd-3c739bd861b9')) AND (report.start_time >= 0)) AND (report.end_time <= 1712838648197)) ORDER BY version.number, report.start_time, report_benchmark.iteration;Do you see the problem? Nope. Neither did I!
The issue is right here:
LEFT OUTER JOIN alert ON (alert.boundary_id = metric_boundary.metric_id)It should actually be:
LEFT OUTER JOIN alert ON (alert.boundary_id = metric_boundary.boundary_id)I was trying to be too clever, and in my Diesel materialized view schema I had allowed this join:
diesel::joinable!(alert -> metric_boundary (boundary_id));I assumed that this macro was somehow smart enough
to relate the alert.boundary_id to the metric_boundary.boundary_id.
But alas, it was not.
It seems to have just picked the first column of metric_boundary (metric_id) to relate to alert.
Once I discovered the bug, it was easy to fix. I just had to use an explicit join in the Perf query:
.left_join(schema::alert::table.on(view::metric_boundary::boundary_id.eq(schema::alert::boundary_id.nullable())))🐰 That’s all folks!